Packet Captures–Cisco Troubleshooting
The case study in the previous section used only the ping command to capture information about the network. What if the problem were host A’s connection to server X is slow, while D’s connection to server X is performing normally? Sometimes, in a case like this, you want to be able to capture packets off the wire and examine the flow for problems.
The most common tool used in the networking industry for capturing and examining packets and flows through a network is Wireshark, an open-source, free-to-use tool. (You can install Wireshark from wireshark.org.)
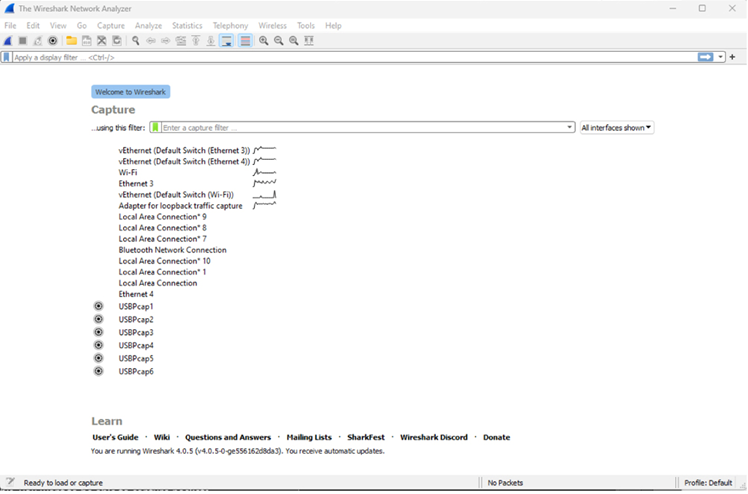
Figure 22-10 shows the screen you will see when you open
Wireshark.

Figure 22-10 The Wireshark Opening Screen
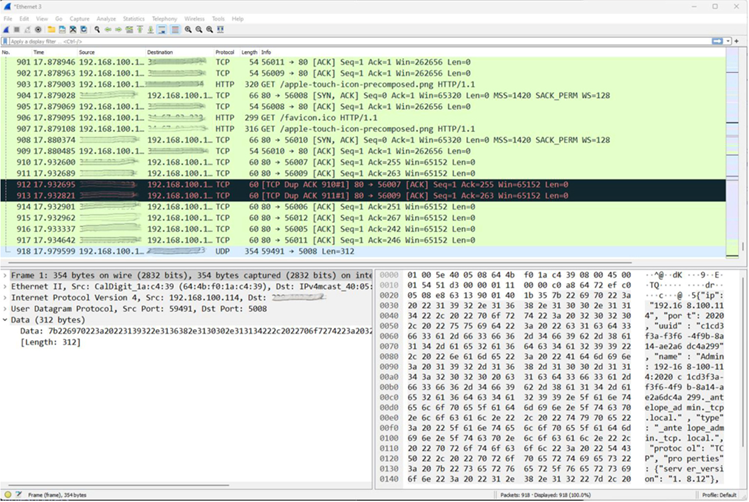
This first screen gives you a list of interfaces from which you can capture packets. You can select multiple interfaces using the Shift and Control keys. Once you have selected one or more interfaces, you can select the upper-left icon on the toolbar to start capturing packets. The result will look like the screen capture in Figure 22-11.

Figure 22-11 Packet Capture Using Wireshark
The Wireshark capture screen has three primary components:
• The top window contains a list of the captured packets. You can select an individual packet to examine from this list.
• The bottom-left window provides information about the selected packet. Wireshark’s developers have programmed in thousands of different packet formats. Wireshark can show you each value in the packets it knows how to decode.
• The bottom-right window is a hex dump of the selected packet.
The hex dump can be helpful if you are looking for patterns in the packet or Wireshark does not know how to decode the entire packet.
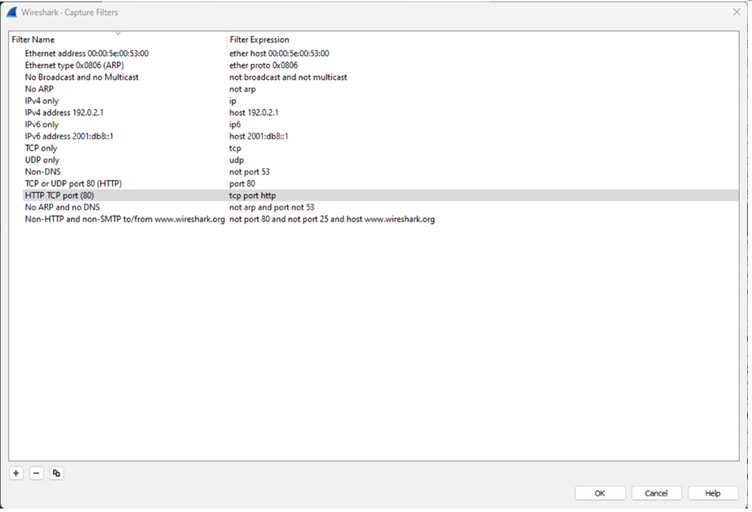
Because Wireshark captures every packet on the selected interface (or interfaces), there will be a lot of information to sort through. Wireshark can capture a subset of the packets, as shown in Figure 22-12.

Figure 22-12 Wireshark Capture Filter Options
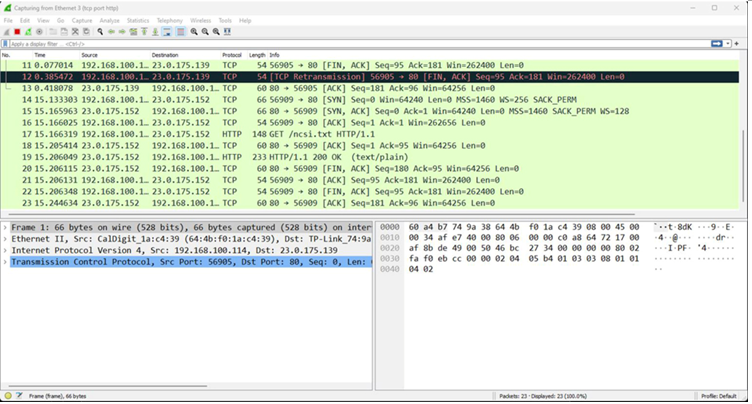
For instance, if you want to see only traffic to and from a web server, you can select HTTP TCP port (80). Figure 22-13 shows a capture with HTTP traffic only.

Figure 22-13 Filtered Wireshark Capture
This capture shows a connection between a host at
192.168.100.114 and a web server at 23.0.175.139. The packets in this capture include the following:
1. A TCP SYN opening the session from the host to the server 2. A TCP SYN ACK, where the server acknowledges the TCP open
3. A TCP ACK, where the host finishes the TCP three-way handshake
4. The first HTTP GET, where the host requests the main file making up the web page
5. A TCP retransmit (apparently, the TCP session dropped a packet)
6. A duplicate TCP acknowledgment, a result of the dropped packet
7. A standard TCP acknowledgment, which is the server acknowledging receiving the TCP packet containing the HTTP
GET
With enough practice, you can trace any packet flow and quickly spot errors such as dropped packets.
You can save packet captures and reopen them for later examination, or even to have records of network failures.
Wireshark uses the .pcap file format to store packet captures.
Most packet capture and analysis software packages use the same .pcap file format.
One valuable Wireshark resource is collections of .pcap files, such as those available at https://netresec.com. These allow you to see what a normal packet flow looks like for
• Virtually every kind of protocol session operation.
• Many kinds of network attacks as they occur.
• The packet captures from penetration exercises.
• Many kinds of malware software sending traffic to command and control systems and installing themselves on devices.
Wireshark, packet capture, and packet analysis are sometimes the only tools to diagnose problems.
